Frames of Mind
Animating R1's thoughts.
[Visit https://github.com/dhealy05/frames_of_mind to visualize your own thoughts!]
Thought Plots
I was curious about text or embedding space patterns in R1's chains of thought, so I saved some and animated the results.
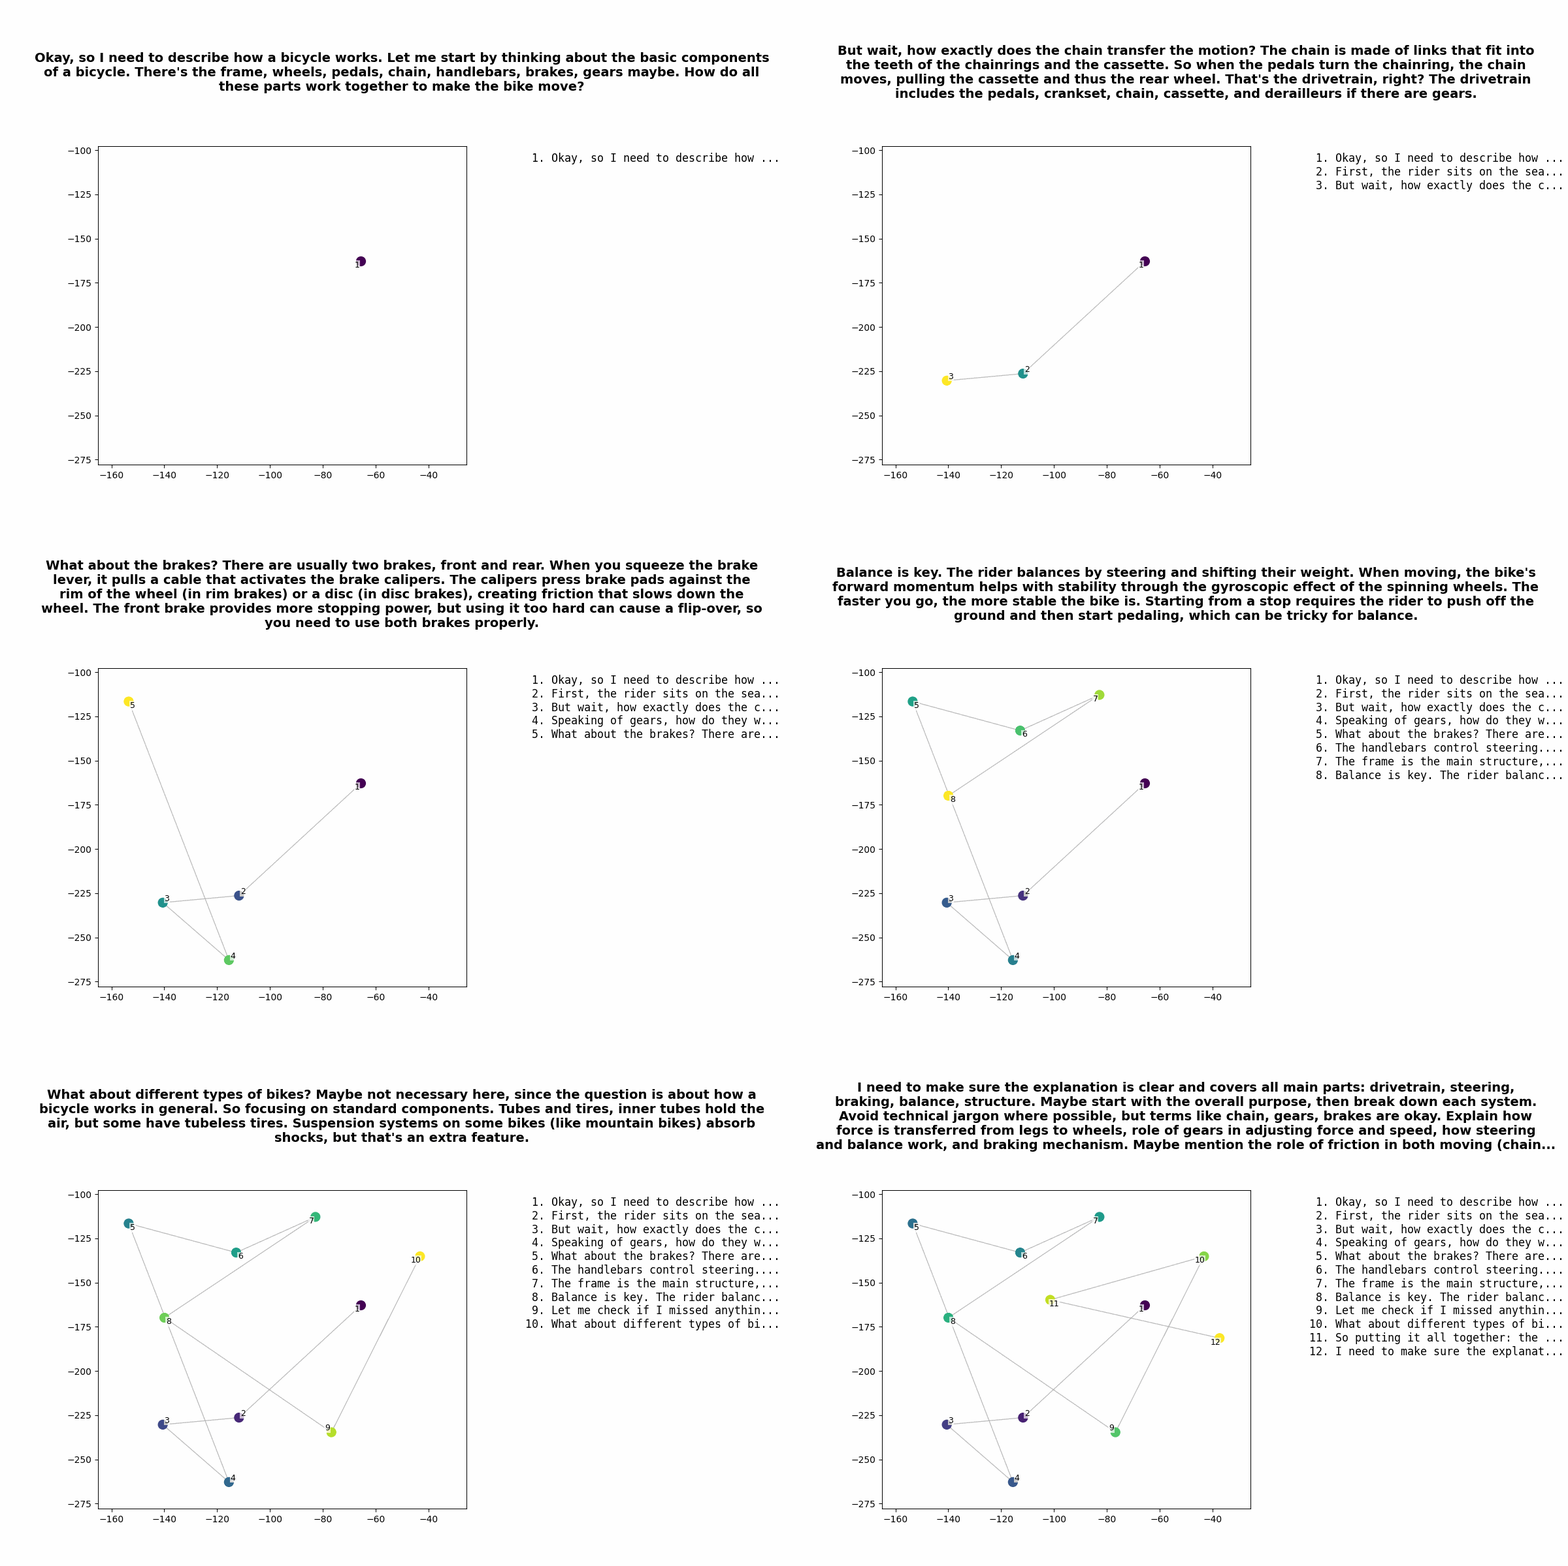
Here's what it looks like when R1 answers a question (in this case "Describe how a bicycle works."):
We can visualize the "thought process" for R1 by:
Saving the chains of thought as text
Converting the text to embeddings with the OpenAI API
Plotting the embeddings sequentially with t-SNE
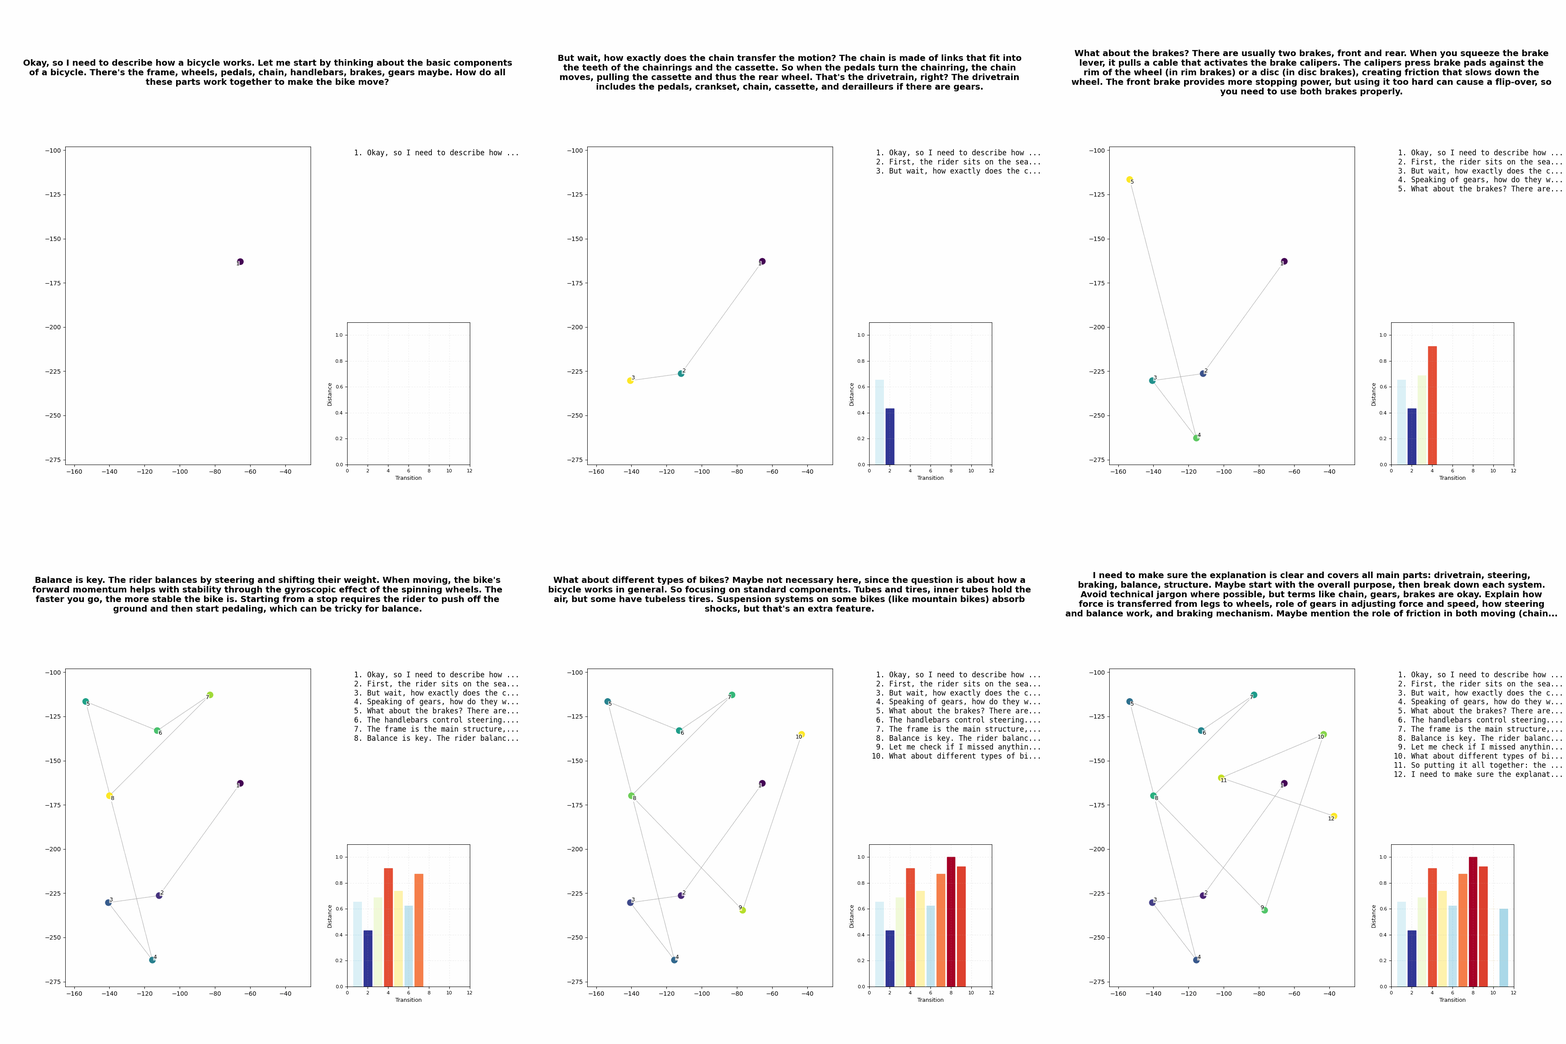
Consecutive Distance
It might be useful to get a sense of how big each jump is. The graph above shows the consecutive comparison, by default cosine similarity normalized across the set of all consecutive steps to 0, 1. Euclidean distance in the t-SNE plot matches better visually but is less accurate to the fundamentals. Normalization may be a matter of preference; I'm interested in seeing when the bigger or smaller jumps happen in the "thought cycle".
Combined Plot
The combined plot shows both at once.
Aggregate Distances
The graph above shows the aggregate distances for 10 samples. To my eyes it looks like a "search" phase where size of step is large, followed by a more-stable "thinking" phase, followed by a "concluding" phase which involves a large spike then drop. Not conclusive at this time.
Interpretability
A.I. safety enthusiasts sometimes miss the forest for the trees: we should have a straightforward and basic understanding of A.I., currently incarnate as LLMs, and straightforward tools to provide it. Animating chains of thought seems like a solid, basic tool.
I don’t draw any strong conclusions about which types of thought patterns are more performant, etc., but possibly for larger models or different questions, patterns would emerge.


